The case studies of RTH data processing are presented below for differ geological region, dimension (2D, 3D) and voxel sizes. Everywhere the step between receivers is 25 m, between sources — 50m, time sampling — 2 milliseconds.
The all attribute estimations are calculated using HPC 50 Teraflops.
The background velocity model is the simple linear gradient:
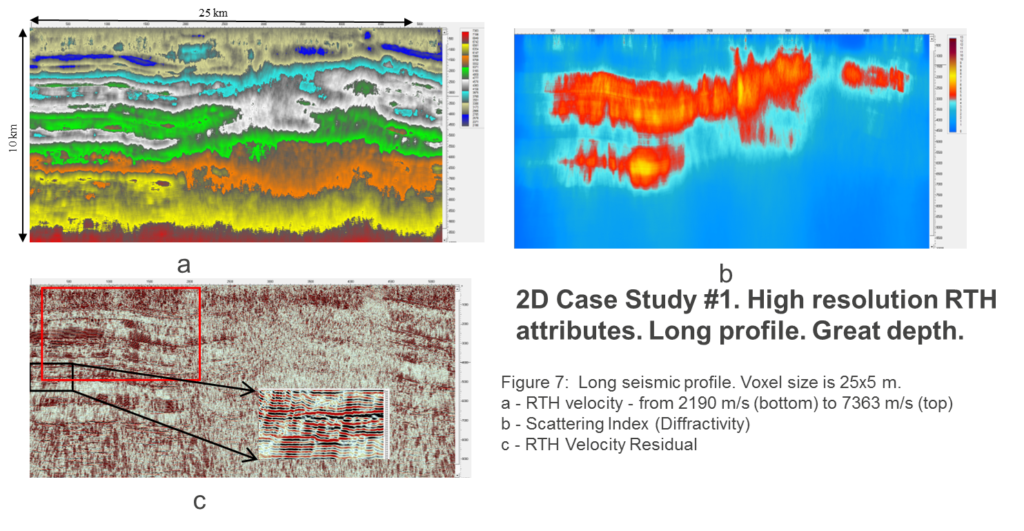
- for 2D case study #1- from 3 km/s up to 7 km/s (for the depth 10 km) -North Arctic (4 sl.)
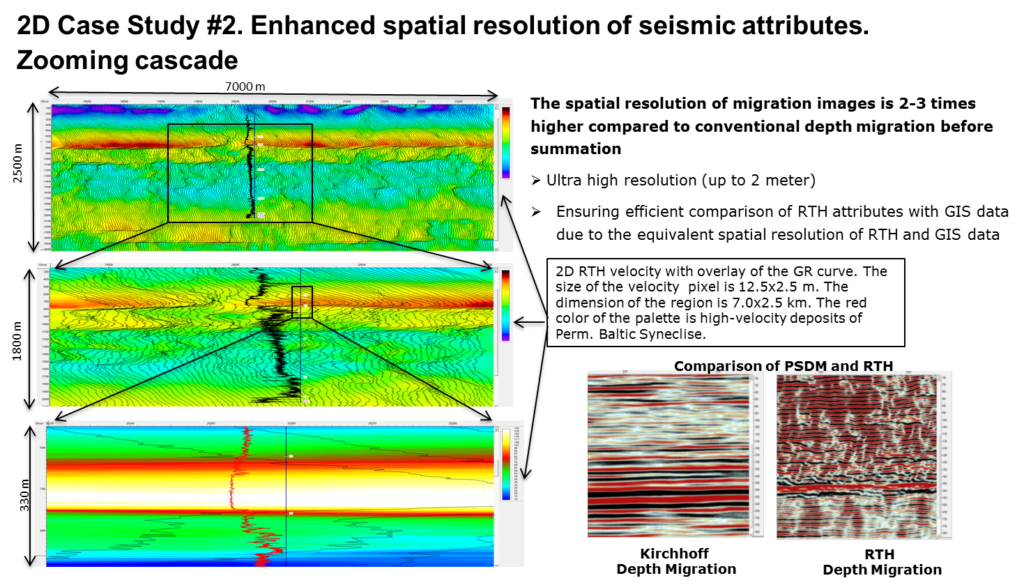
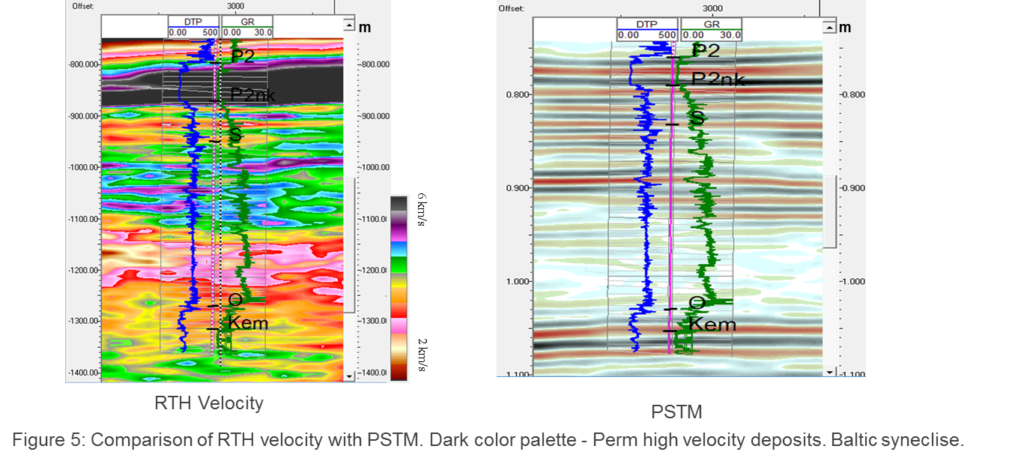
- for 2D case study #2 — from 3 km/s up to 3.75 km/s (for the depth 3 km)-Europe, Baltic (1sl.)
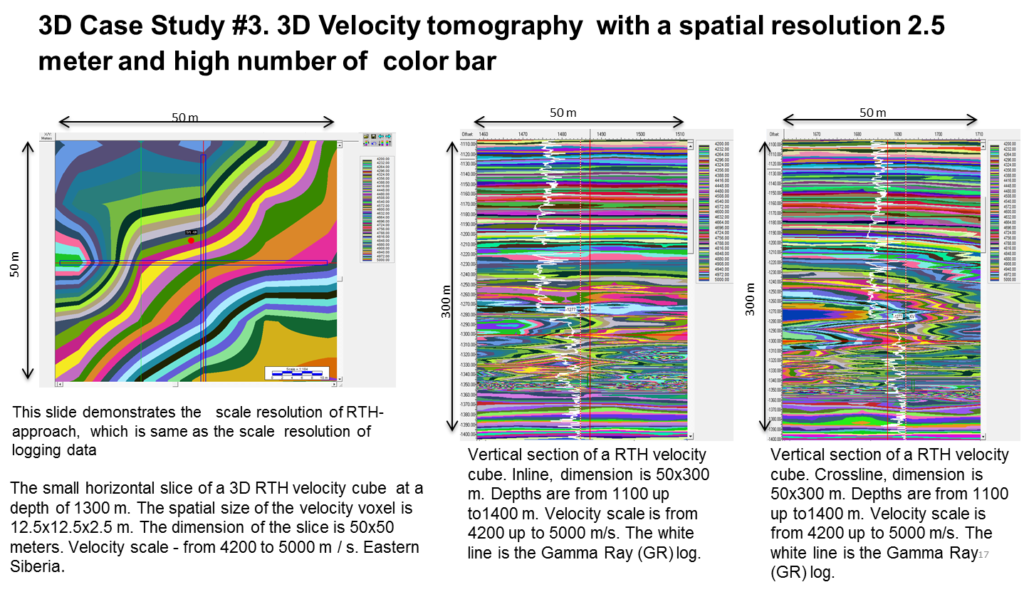
- for 3D case study #3 — from 5 km/s up to 5.2 km/s (for the depth 2 km)- Eastern Siberia (1sl.)
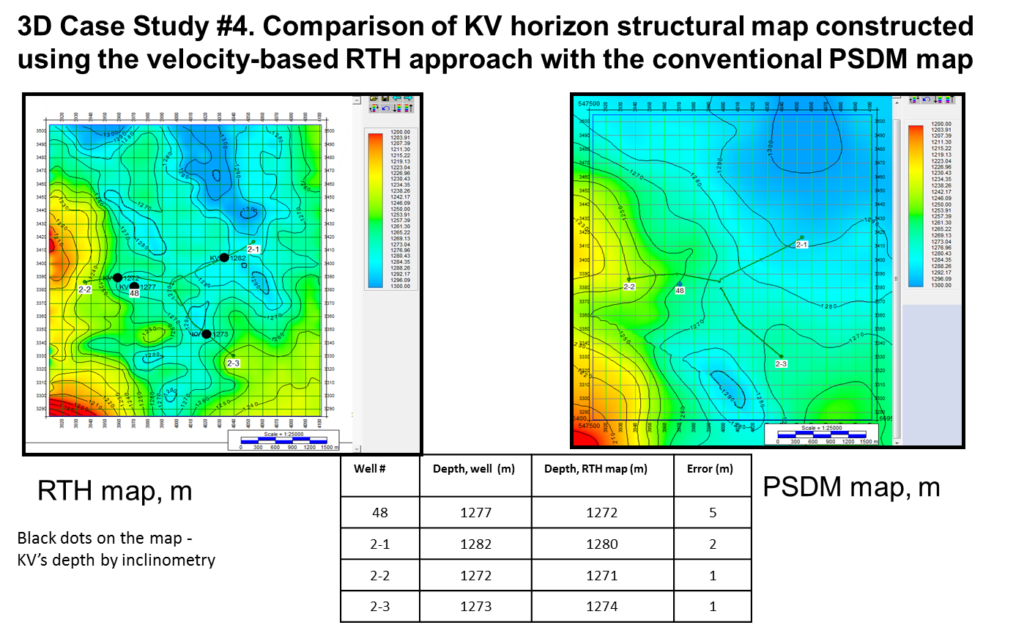
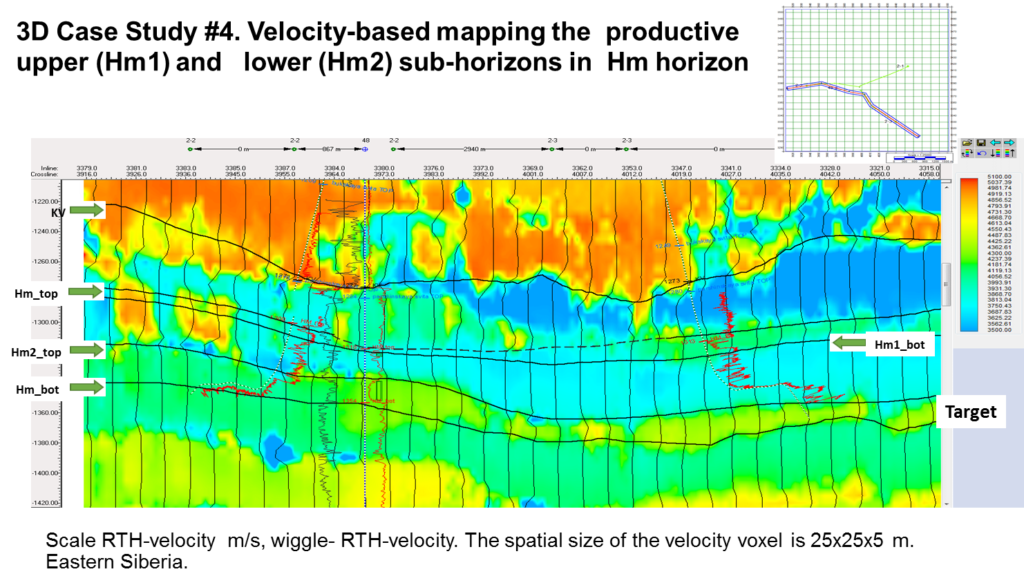
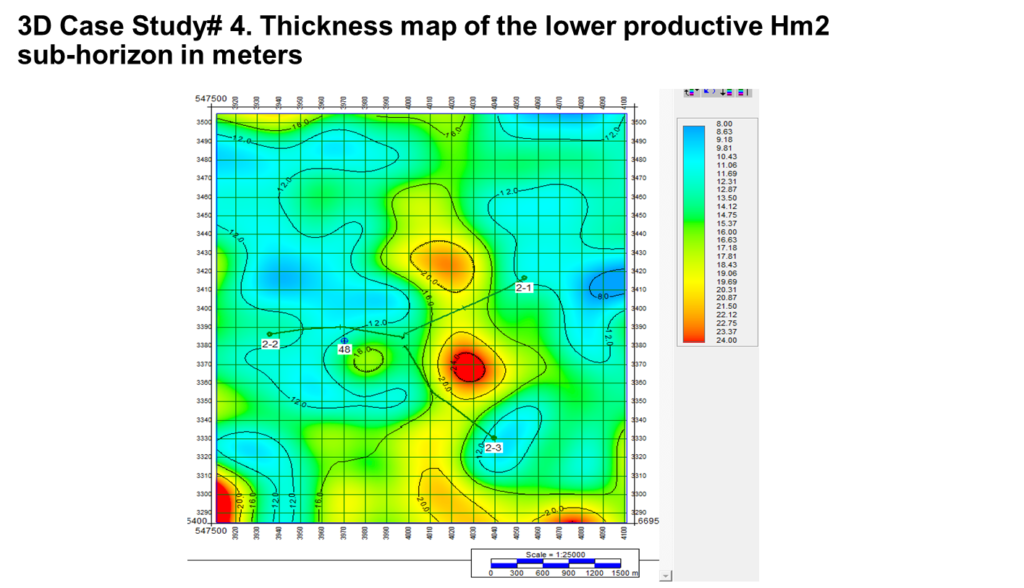
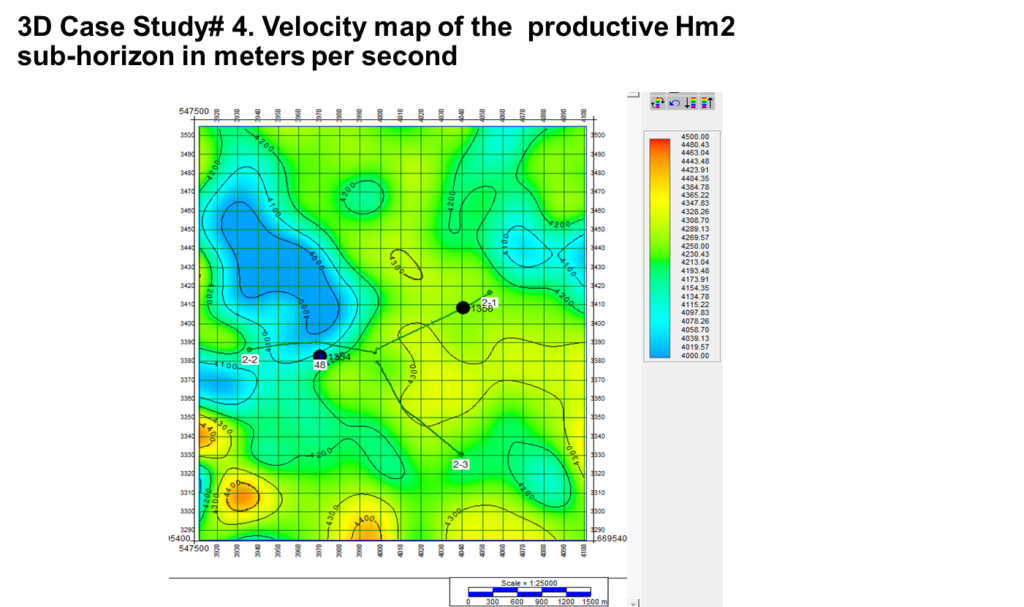
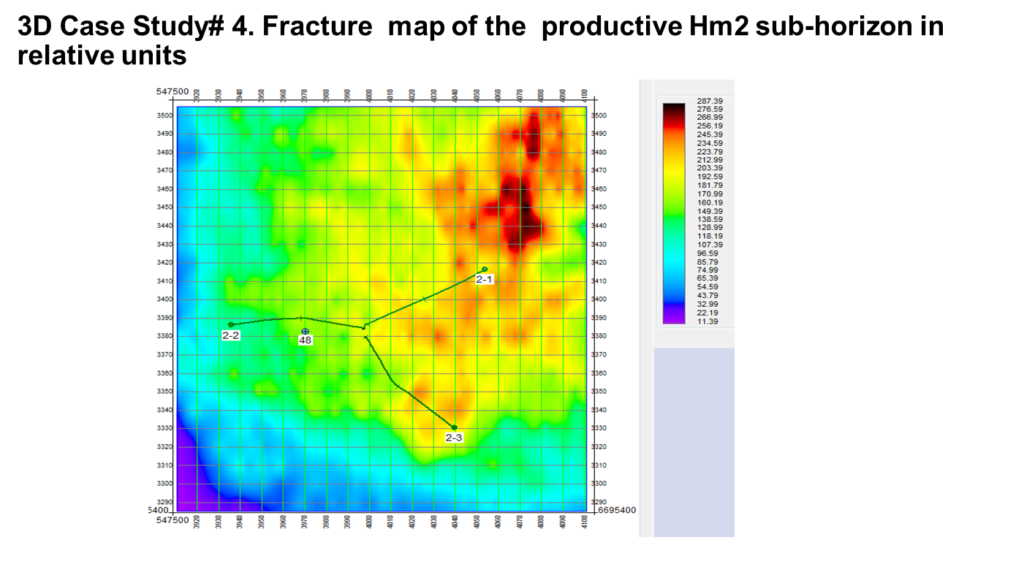
- for 3D case study #4 — from 5 km/s up to 5.2 km/s (for the depth 2 km)- Eastern Siberia (5sl.)
- for 2D case study #5 — from 2 km/s up to 4 km/s (for the depth 3 km)-Europe, Baltic (1sl.)